Data & Analysis

Getting Things Done with Office 365 Data and Analysis Tools

They say time is money, and anyone who’s serious about Getting Things Done knows all about the importance of time management.

Often the biggest issue is team productivity. Time management is a major issue in most businesses.

Thankfully Office 365 is packed with a ton of productivity boosting tools to make things easier and more efficient.

We take a look at five great tools for managing and analysing data  that can help you and your staff get more done, in less time.

1. Speed through Excel Data with Flash Fill

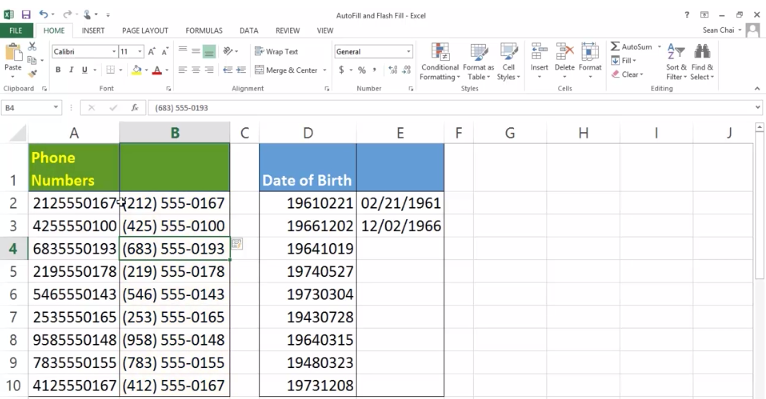
Auto fill can already help ease the monotony of completing repetitive data like dates and postcodes, but Flash Fill takes things one step further. Because it recognises patterns in data it allows users to whizz through laborious entry and instantly splits appropriate columns of information.

Watch the video and discover how easy it is, or read Microsoft’s quick guide here.

Excel Flash Fill
Sparklines

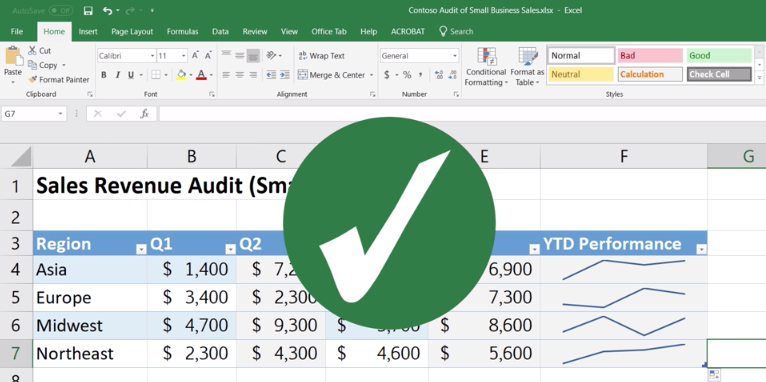
2. Use Sparklines to show data trends

Excel’s Quick Analysis tool enables you to instantly visualise your data in just a few steps – simply select the cells that show the information you want to present and the software will do the rest.

Watch the video and discover how easy it is, or read Microsoft’s quick guide here.

3. Discover Geospatial patterns with 3D Maps

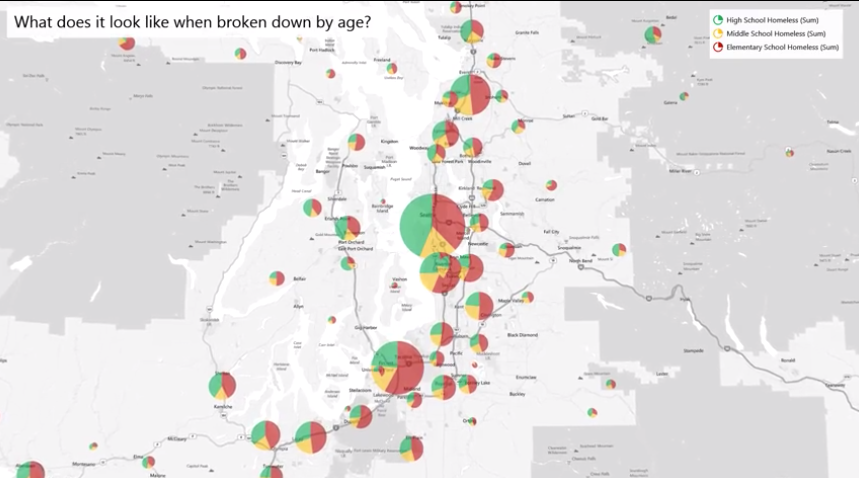
Previously known as Power Map, this handy visualisation tool allows you to discover patterns in your data related to location, time and demographics. It’s a great way to look at information in new ways, adding real meanings behind the numbers in just a matter of minutes.

Discover how easy it and read Microsoft’s quick guide here. 

3D Power Maps

4. Prioritise your work with the MyAnalytics Personal Dashboard

The MyAnalytics dashboard gives you the tools you need to help you prioritise work and spend time more effectively. With the Time Summary you can quickly view the four main ways that your time has been spent broken down into Meeting Hours, Email Hours, Focus Hours and After Hours. Whether to celebrate achieving a goal, show progress to your manager, or ask for help, you can share selected statistics from your dashboard with people in your organisation. By sharing statistics, you create more opportunities to receive support in the areas that matter most to you.

Check out Microsoft’s guide to start sharing your statistics and get the conversation started.

5. Search, make connections and shape your data with Get & Transform in Excel

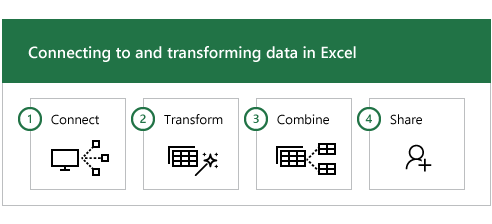
With Get & Transform in Excel, you can search for data sources, make connections, and then shape that data in ways that meet your needs. As you transform data, it collectively takes on the shape you need to further your analysis.

A feature called Query Editor also lets you undo, redo, change the order, or modify any step; all so you can shape your view of the connected data just the way you want it. Combine multiple sources to get a unique view on the data ready to be shared or used in reports.

Read Microsoft’s quick guide here.

Get and transform excel

Need advice or support?

Dragon IS is an IT support company based in Milton Keynes. We work with small and medium sized businesses, helping them with a broad range of issues relating to their IT systems, processes and procedures.  From expert advice and guidance, to introducing systems that can effectively scaleup with a growing business, call us for an informal chat on 01908 613 080 or email info@dragon-is.co.uk


You may also be interested in:

Office 365 News

Get the latest Office 365 updates news and tips right here…

Sign up for more Productivity Tips & Tricks

Pick up the IT skills and techniques you need to be more proactive, productive and prepared at work with our Power of Productivity email series.

If you’d like your team to be super productive (and why wouldn’t you?) why not sign up for more handy guides like this one.